A significant component of this institutional monitoring is the University’s maintenance of Sex-Disaggregated Data (SDD) for Employees. EVSU systematically documents the number and distribution of male and female employees across its workforce. Its published employee statistics covering 2019 to 2025 demonstrate the University’s continuing practice of collecting and organizing personnel information according to sex. These records provide a baseline for analyzing gender representation across teaching and non-teaching positions, identifying workforce composition patterns, and supporting evidence-based human resource planning. By integrating sex-disaggregated workforce information into institutional monitoring, EVSU strengthens its capacity to identify potential gender imbalances in employment distribution and compensation structures.
1. Relatively Balanced Workforce Representation
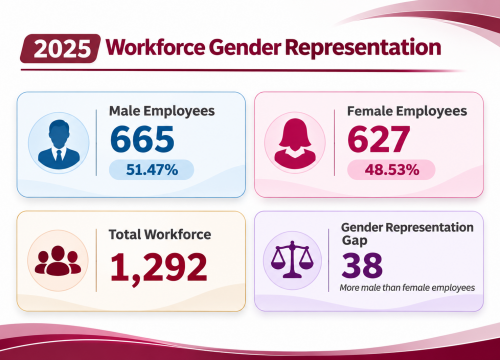
In 2025, EVSU recorded a total of 1,292 employees, consisting of 665 males (51.47%) and 627 females (48.53%). The difference between male and female employees was only 38 individuals, equivalent to a 2.94-percentage-point gap.These figures indicate that women maintained a substantial presence in the University’s workforce, representing nearly half of its total personnel. The relatively narrow difference suggests that EVSU sustained a generally balanced gender composition in its employment structure, reflecting women’s continued participation in the University’s academic, administrative, and operational activities.
2. Sustained Participation of Women in Institutional Employment
The female workforce representation of 48.53% in 2025 demonstrates the continued participation of women in EVSU’s institutional operations. This is particularly notable given that female employees constituted a significant proportion of the University’s personnel, highlighting their contributions to instruction, research, extension, administration, and other institutional functions.
From a gender equality perspective, this provides a favorable institutional baseline for promoting equal employment opportunities and strengthening gender-responsive human resource management. It also underscores the importance of maintaining an inclusive working environment where women and men have equitable access to recruitment, appointment, professional development, and career advancement opportunities.
3. Comparison with Previous Years
The 2025 data also demonstrate a favorable improvement in female workforce representation compared with the preceding year.
| Indicator | 2024 | 2025 |
|---|
| Male employees | 673 | 665 |
| Female employees | 642 | 627 |
| Total employees | 1,315 | 1,292 |
| Male representation | 51.18% | 51.47% |
| Female representation | 48.82% | 48.53% |
Although the total number of both male and female employees decreased in 2025, the overall gender distribution remained relatively stable. Female representation declined slightly by 0.29 percentage points, while male representation increased by the same proportion.
Nevertheless, the female workforce continued to account for almost half of the University’s personnel, indicating sustained women’s participation in institutional employment.